I live in San Francisco’s Castro neighborhood and wanted a better way to keep an eye on what’s going on — potholes, graffiti, tree issues, and other service requests. Instead of waiting for monthly digests or digging through city dashboards, I built my own live map.
This was a chance to flex my GIS skills and stitch together an open-source stack I fully control — from ETL and spatial filtering to GeoServer and a React Leaflet frontend. Now I can check what’s happening in the neighborhood any time, from any device.
🛠️ Project Overview
The setup is split across two GitHub repos:
-
📦 ETL Pipeline
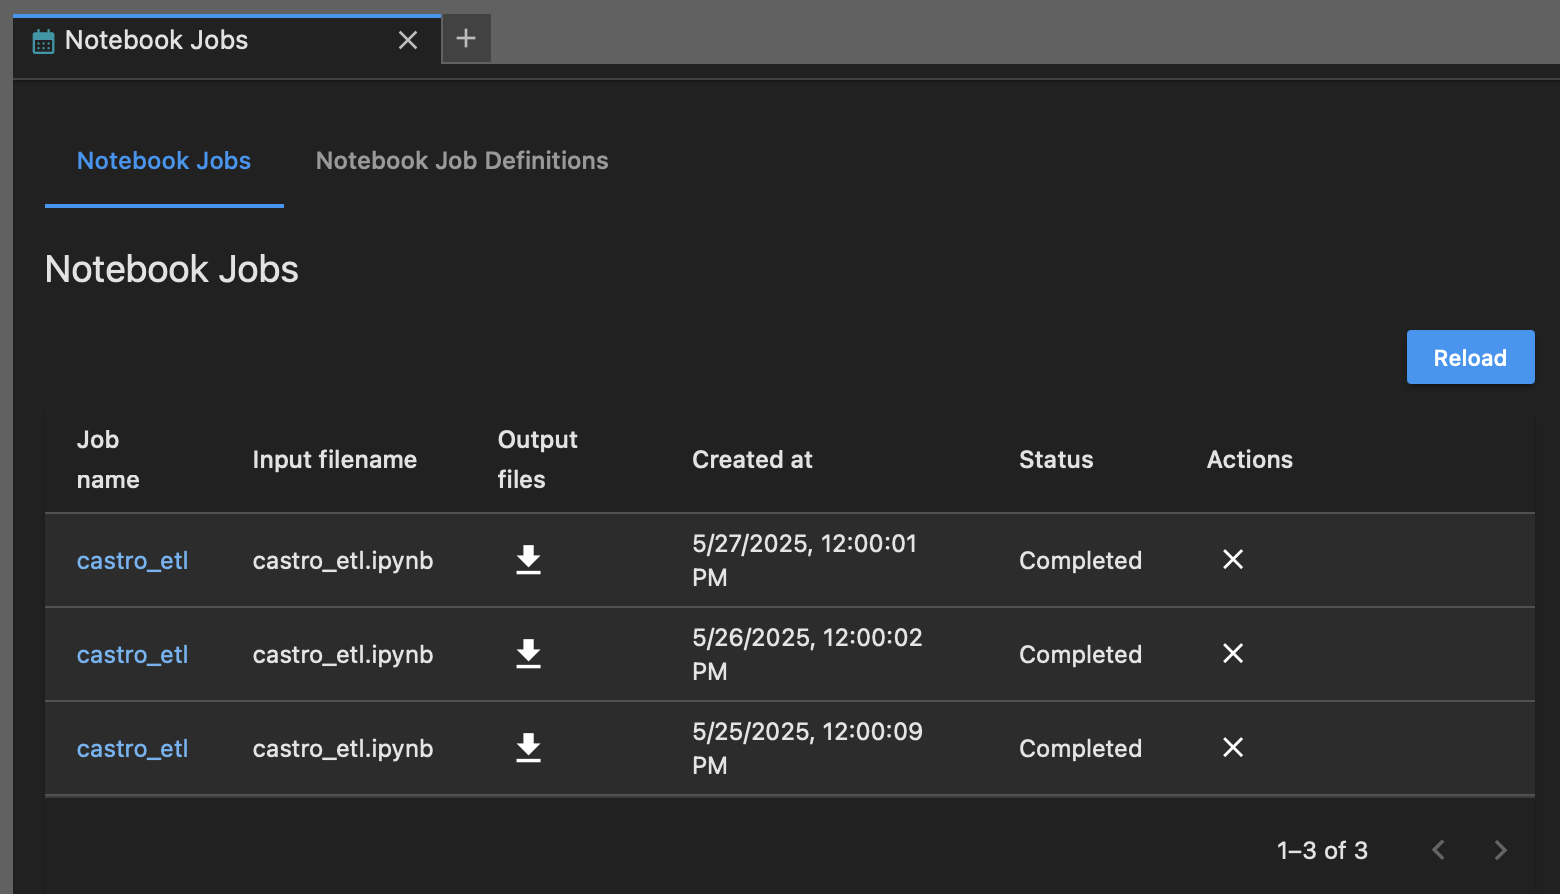
A Python notebook that fetches 311 data from SF’s Socrata API, filters it spatially to the Castro, and loads it into a PostGIS database. It’s automated using JupyterLab’s built-in Notebook Job scheduler — no cron, no external triggers. -
🌐 Frontend Dashboard
A responsive web app built with React + Vite + React Leaflet. It fetches live GeoJSON from GeoServer’s WFS endpoint and displays it on an interactive map — hosted via GitHub Pages.
⚙️ ETL Details
The notebook does the following:
- Extract 311 data from the Socrata API
- Transform it using
GeoPandas— buffer to 1 km from Castro Muni, reproject, clean - Load into a PostGIS database using
sqlalchemyandto_postgis() - Publish as a WFS layer via GeoServer
WFS endpoint:
GetCapabilities
🗺️ Frontend
The dashboard loads live GeoJSON via fetch():
const url = "https://geoserver.danielmyers.xyz/geoserver/census/castro_311/ows?service=WFS&version=2.0.0&request=GetFeature&typeName=census:castro_311&outputFormat=application/json"
fetch(url)
  .then(res => res.json())
  .then(data => setGeoJsonData(data));
Data is rendered with React Leaflet and updated every time the page loads.
🚀 Try it in full-screen
🖱️ Interactivity
The dashboard isn’t just a static map — it’s built for real-time exploration. Features include:
- ✅ Live filter sync — Clicking a request type in the list filters the points on the map to only that category
- 💬 Interactive popups — Clicking any point reveals key info about the request, including type and open date
- 📱 Touch-friendly — Works well on mobile devices with tap interactions and stacked layout
All points shown on the map represent currently open 311 service requests as of the most recent ETL run.
🔗 Related
Want to learn more about how I set up the infrastructure for this?
Read my post: How I Built My Personal AWS GIS Stack
💡 Takeaways
- ETL doesn’t have to be complicated — Jupyter +
GeoPandas+ PostGIS works great - GeoServer is underrated for WFS publishing in custom stacks
- React Leaflet + GitHub Pages = a lightweight, full-featured map app
- Open data is way more useful when it’s cleaned and localized
Built with 💙 in SF.